Interpretation
We first explain the output of the comment in the PR:
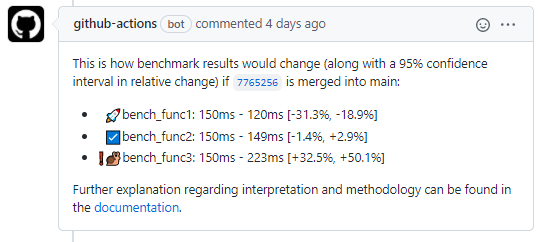
Every bullet point corresponds to one expression you benchmarked in
your touchstone script in touchstone/script.R with
benchmark_run(). The contents of the former are in this
(simplified) example:
library(touchstone)
branches_install()
benchmark_run(
  expr_before_benchmark = c("library(styler)", "cache_deactivate()"),
  without_cache = 'styler::style_pkg("touchstone/sources/here")',
  n = 30
)

benchmark_run(
  expr_before_benchmark = c("library(styler)", "cache_activate()"),
  cache_applying = 'styler::style_pkg("touchstone/sources/here")',
  n = 30
)

benchmark_run(
  expr_before_benchmark = c("library(styler)", "cache_deactivate()"),
  cache_recording = c(
    "gert::git_reset_hard(repo = 'touchstone/sources/here')",
    'styler::style_pkg("touchstone/sources/here")'
  ),
  n = 30
)

benchmarks_analyze()
You can see that the expression
cache_applyingtook on average 0.1 seconds on both branches.And if we merge this pull request,
cache_recordingandwithout_cachewill be approximately 0.01 quicker than before the merge.
Imagine we only ran all expressions once per branch. Then, the
differences could be by chance. To avoid that, we run it n
times and compute a confidence interval, which tells us how certain we
can be about our estimated differences. A 95% confidence interval tells
us that if we were to repeat the benchmarking experiment 100 times, our
estimated speed change would be in the interval 95 out of 100 times. It
comes from a simple ANOVA model where we regress the elapsed time on the
branch from which the result comes. Like this:
We could in addition also control for block, but as we
only have two observations per block, this required a lot of parameter
estimates and would take away statistical power from our parameter of
interest. Our estimates are also unbiased without it.
Since changes in percent are more relevant than absolute changes, the
confidence interval is reported relative to the target branch of the
pull request. The measured difference is statistically significantly
different from zero if the confidence interval does not overlap with 0.
In the screenshot above, this is not the case for any benchmarked
expression, as they all range from some negative to some positive
number. If you increase n, you can estimate the speed
implications of a pull request more precisely, meaning you’ll get a more
narrow confidence interval which more likely does not cover zero. You’ll
then easily reach statistical significance (and the CI run will take
longer), but do you really care if your code gets 0.000001% slower?
Probably not. That’s why you also need to look at the range of the
confidence interval.
Sampling
We sample both branches in n blocks. This gives us a
more efficient estimate of the speed difference than the completely at
random, because completely at random can result in or close to one of
the following scenarios assuming there is an upwards trend in available
compute resources over the whole period:
We run the PR branch
ntimes before we run the target branch, the PR branch is at disadvantage.If we always switch branches, the first branch is at disadvantage.
The opposite effect occurs when compute power steadily decreases. So we sample randomly within blocks:
touchstone:::branches_upsample(c("main", "feature"))
#> # A tibble: 40 × 2
#>    block branch
#>    <int> <chr>
#>  1     1 main
#>  2     1 feature
#>  3     2 feature
#>  4     2 main
#>  5     3 main
#>  6     3 feature
#>  7     4 main
#>  8     4 feature
#>  9     5 main
#> 10     5 feature
#> # ℹ 30 more rows